When we look at brands in a certain category more often than not you will first look at growth in dollar sales. At first glance it may tell you how these brands are performing but it could be only showing you one part of the picture. Looking at what is called Equivalized Sales or EQ for short may help you to understand what is going on at the unit sales level. EQ measures total physical sales and commonly uses pounds, ounces or cases as the measure throughout a category. This is especially helpful when looking at items in category such as cookies, where package sizing tends to change. Are shoppers buying more product or is it that more smaller package sizes purchased are the result of unit sales? More times than not the metrics we look at are only the beginning to asking the right questions.
Before looking at EQ sales keep in mind that all items need to be calculated using the same unit of measure. For example, you do not want to cross compare one item measured in ounces against another item measured in pounds. So, make sure you are deciding on a standard unit of measure across items being evaluated.
Let’s take a look:
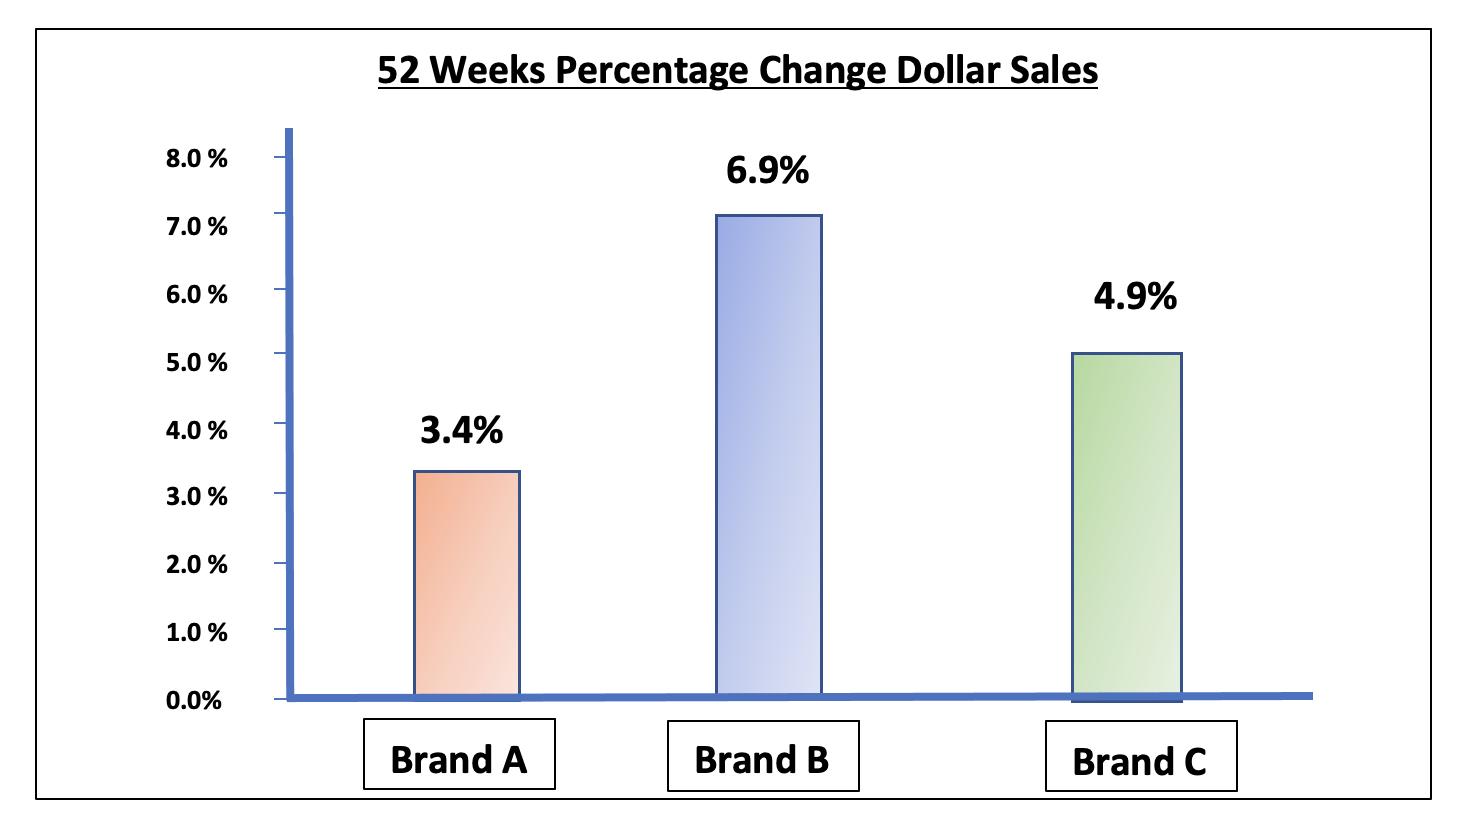
If we look at the yearly percentage change in dollars from a particular retailer we see by looking at just this metric : Brand A has a dollar sales growth of +3.4% from a year ago, Brand B has the highest sales growth from last year with +6.9% and finally Brand C finishes off at +4.9 dollar sales growth from last year.
Now let’s look at the unit sales for these three brands for the same length of time (52 weeks):
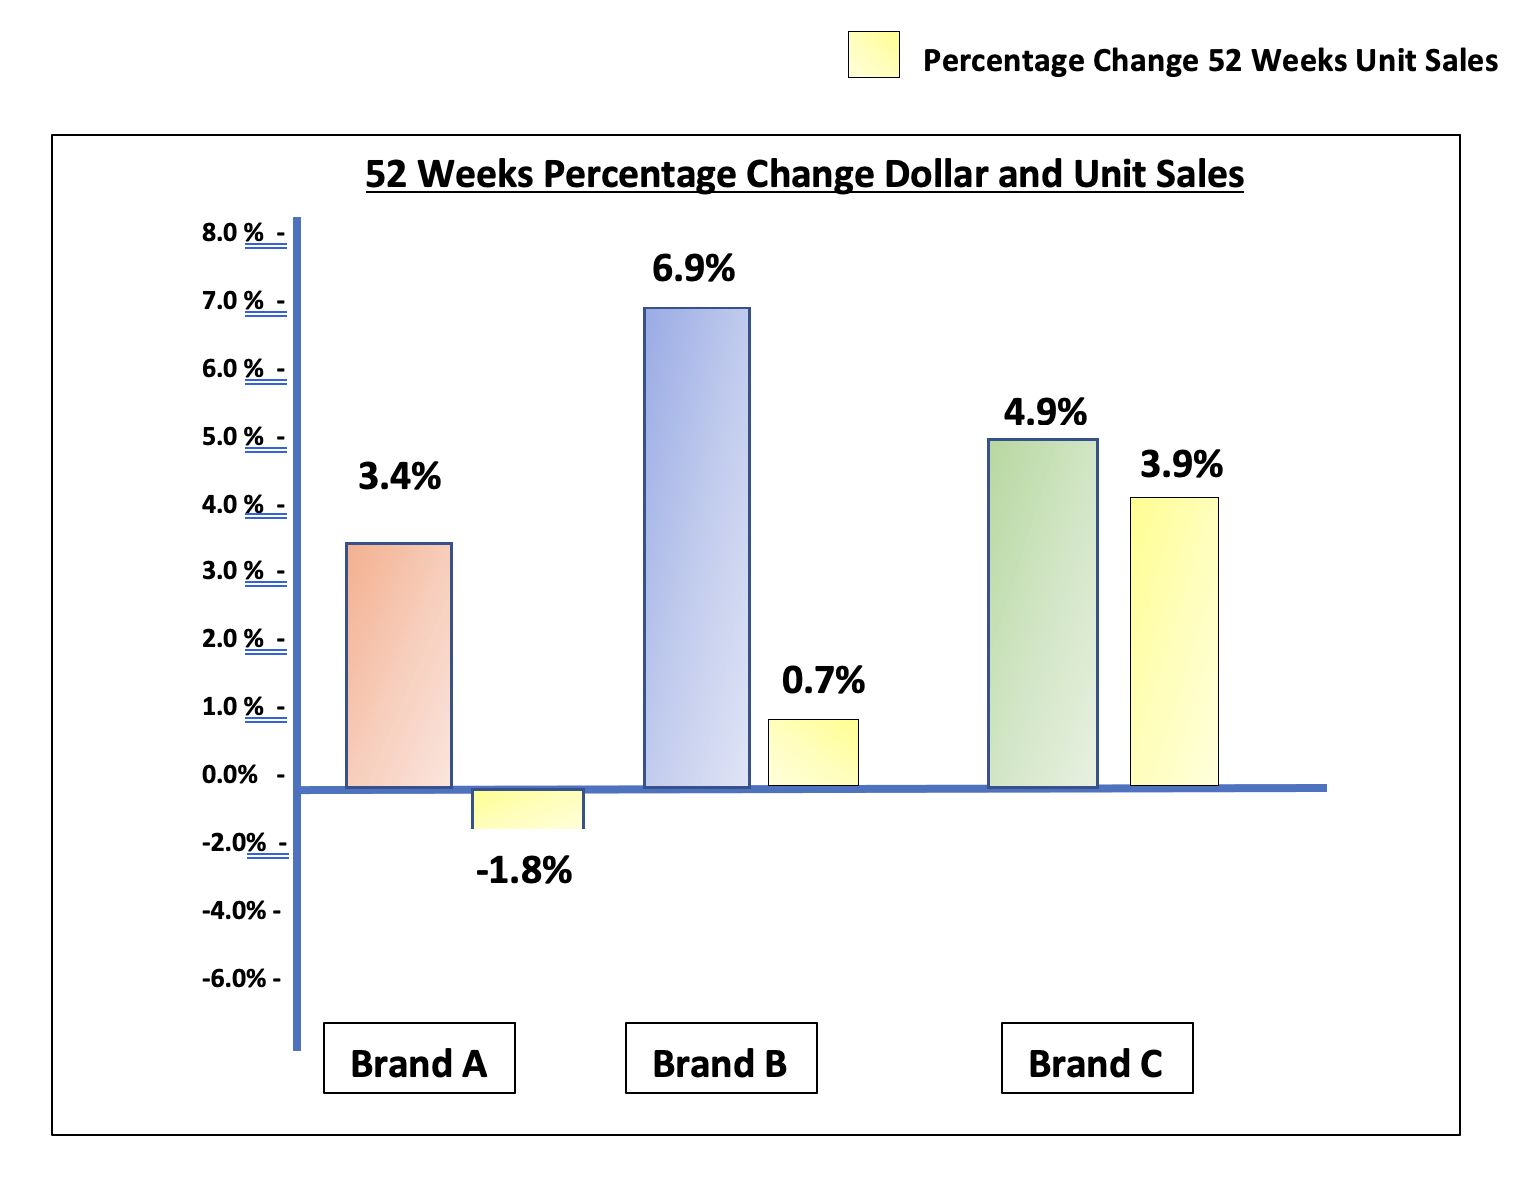
As we input Unit Sales into the equation for the 52 weeks, we see that Brand A may be in a little less firm ground as their unit sales are down although posting higher sales dollars. Brand B is showing a larger dollar sale however only a small gain in unit sales and Brand C seems to be performing the best as they are seeing both dollar and unit sales growth.
Now that we have looked at both unit and dollar sales, we paint even a bigger picture by adding in EQ volume:
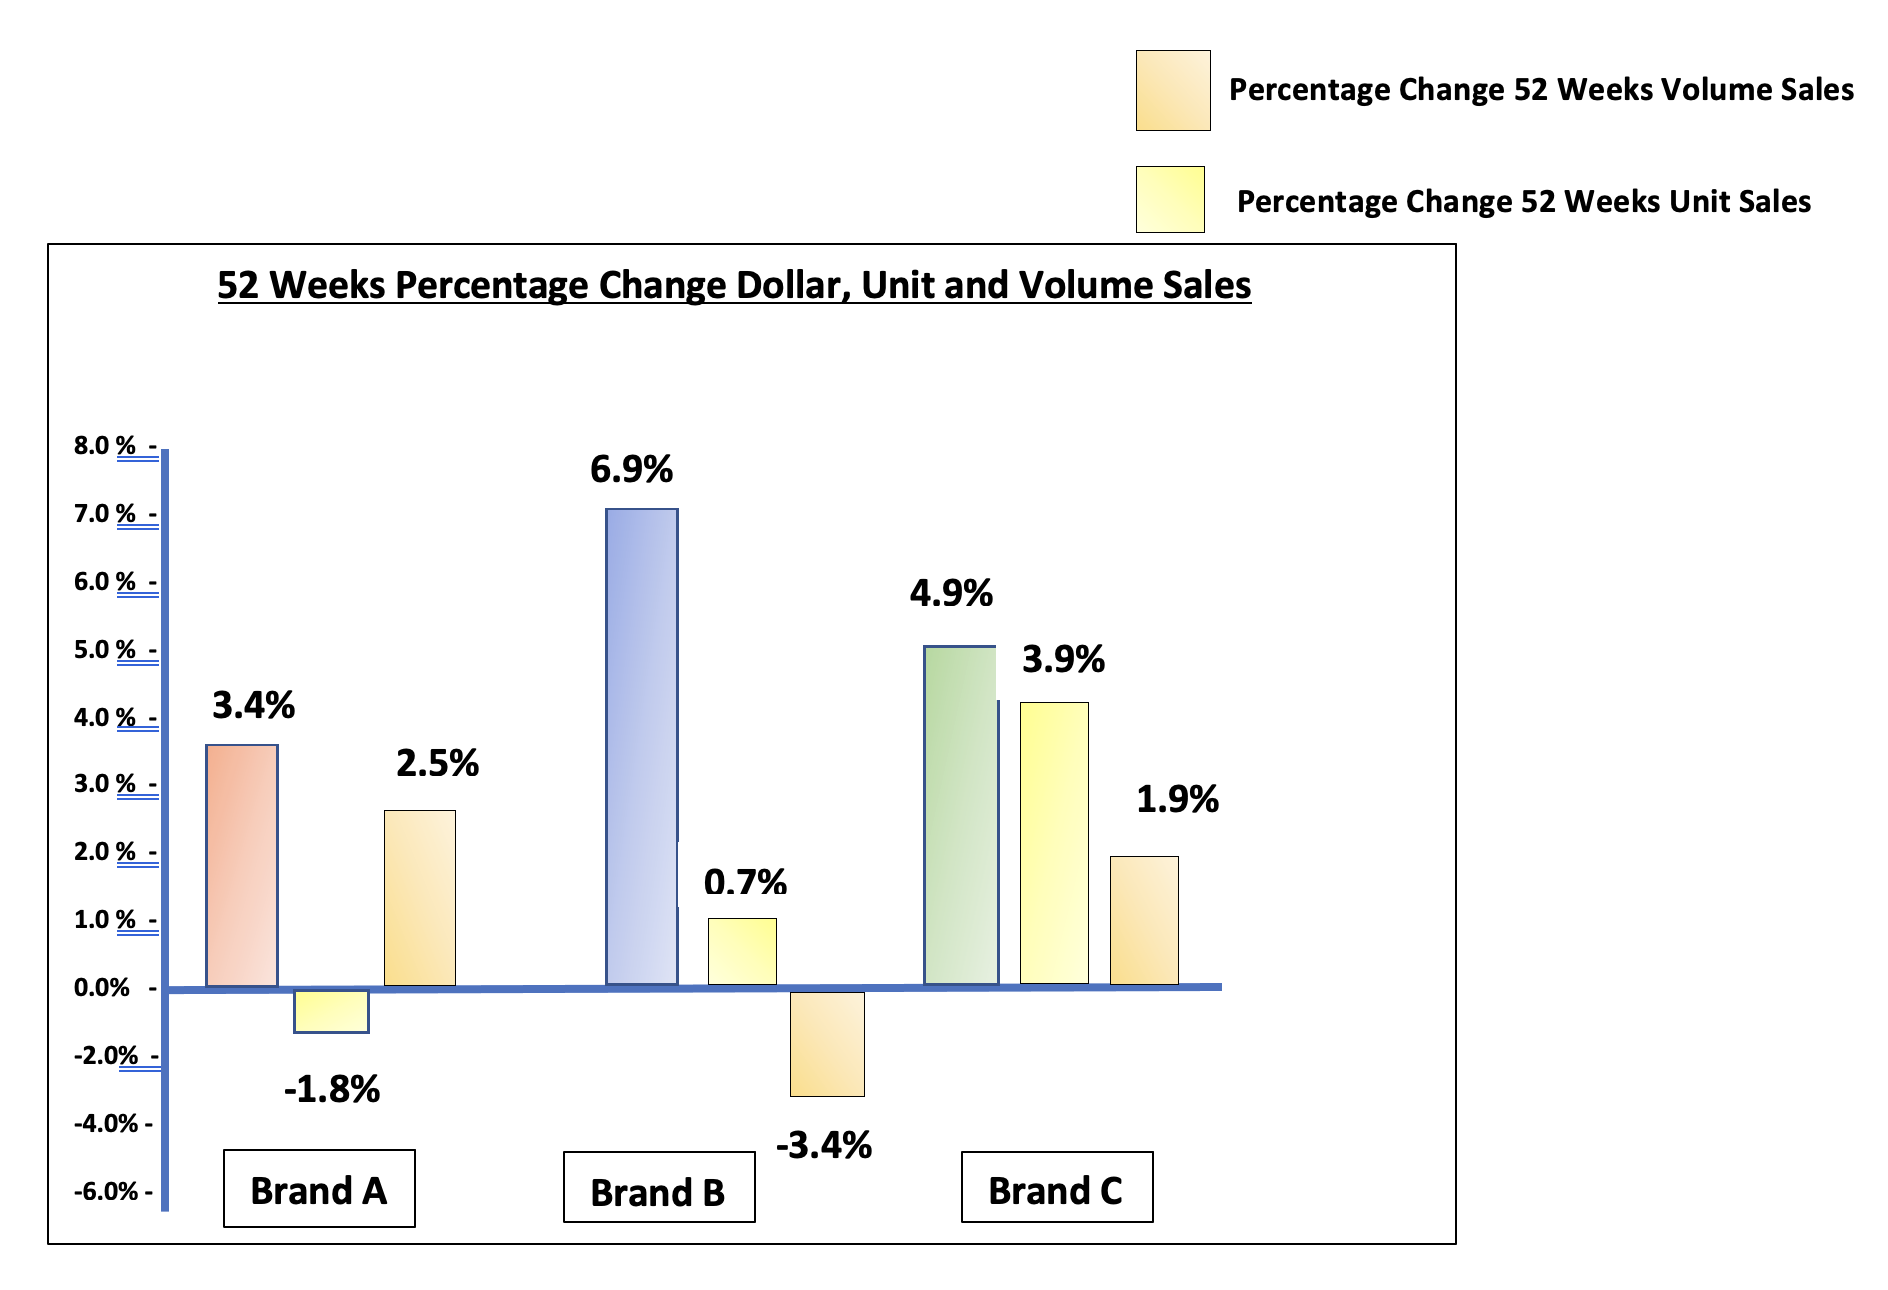
Examining the three metrics we can see that Brand A has increased dollar sales, declined unit sales and increased EQ volume. This can point to an average increase in pricing along with a packaging that is larger, the unit size is larger. Brand B has increased dollar sales, relatively flat unit sales and a declining EQ volume sales. This could point to an average higher pricing with a smaller average unit size. Brand C has increased dollar sales, increased unit sales and slightly increased EQ volume. It may show that Brand C as maintained pricing or slightly increased it while offering relative same sizing or slightly increased in size.
By cross-comparing metrics with your dollar sales it may paint a bigger picture which can allow you to come to some detailed conclusions in category. When adding EQ volume into your metrics it can help understand what’s going on at the unit level. You can also measure the amount of share your product holds in the respective category as a whole. This involves totaling and getting an average of size of units sold and multiplying this by total units sold. This may be a good follow up article from the one here today!