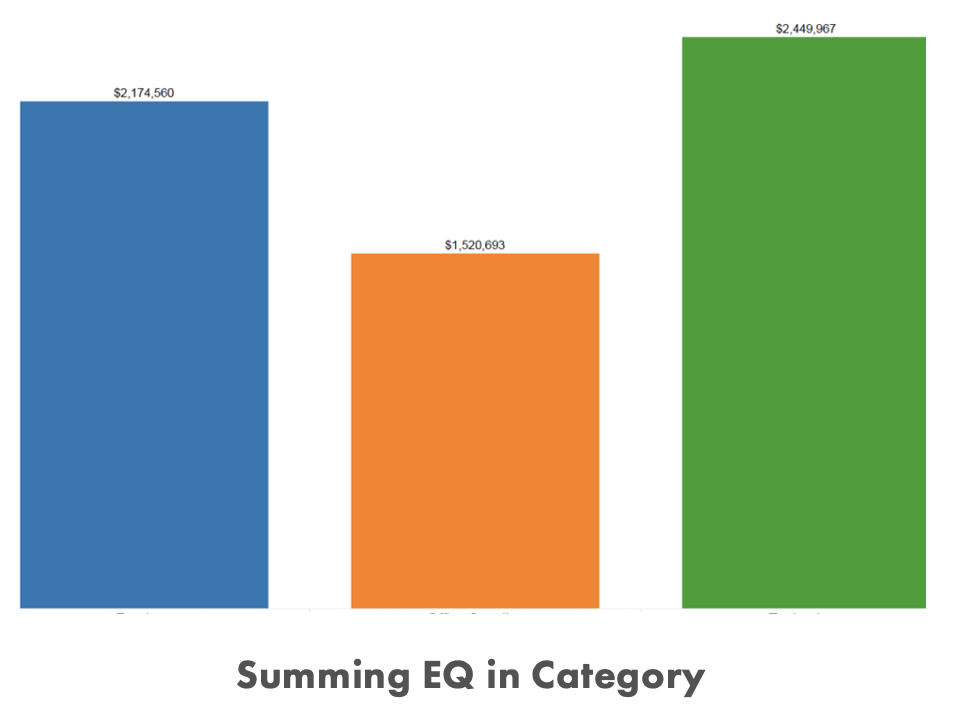
Following up from the previous article on equivalized sales (EQ for short) we can look at EQ and calculate total share in a given category. As we are aware and mentioned in the previous article by just looking at dollar sales it may not be showing us the total trend. By adding in both unit and EQ sales this can help to help fill in the story. Customizing your databases can show these calculations of category share again keep in mind if you are doing the calculating that you are converting all products into the same unit of measure i.e., pounds or ounces. Here we will layout the data as shown in the Data Tip Sheet articles as I believe this has been the clearest of anything I have seen out there. Remember we are summing and averaging here so we can look at EQ sales at the item, brand and category level:

As we can see using this example above again looking at unit and EQ sales can give you a bigger picture on what is going on with your brand beyond sales dollars.
In the example above as we look at category share using these tools, we see that although both brands have the same unit sales giving them the same unit percentage share in category (1,800 in unit sales and 50% unit share) Brand Y has a much larger EQ share (61.9%) as a result from larger item sizes (16 and 20 oz). This can help us explore and come to some other conclusions when analyzing category.
There is much written on the subject of negotiation management. All the pieces need to work in harmony in any key sales process. Jim Camps sales negotiation approach famously put forth in his book Start with No, is a great summation of how to use these pieces in effective sales negotiating. Acknowledging the other party’s concerns and needs (often written under the term need state) along with what Camp states as your Mission & Purpose are two critical pieces to any sales negotiating.

Often missing in some organizations is how the mission and purpose statement links up with how you operate effectively on a daily basis and meet your goals. Negotiation is at its heart, clear and effective decision making. Mission gives purpose and can be seen as the guidance system. This is the bedrock of the Camp system of negotiation.
By linking your M&P with your negotiating you need to develop the habit as Jim says “of referring to it on all matters great and small, because it gives you crystal-clear guidance in all cases”.
“Your Mission and Purpose should be set in the world of the party whom you negotiate with. Your Mission is set in the other party’s world, where the need state is. Once you have stepped into the other party’s world this is what drives understanding and clarity limiting false assumptions allowing both parties to see clearly. It has been said again and again, “the Customer comes first”. Most businesses will not thrive without this. To quote Jim “Over the long haul, you put profits in the bank by putting the customer first”. As pointed out in Camp’s book by using a mission statement created by an artist and storyteller who has a successful business, the mission is solely focused on the world of his customer:
My mission and purpose is to help people see, discover and decide to experience this world as a world of imagination and possibility and healing. We do this by sharing our stories and the model of our company, in a way that is sustainable now and into the future our children will inherit.
This M&P stays away from the problem of being I-centered, which is set in the world of the individual not the other party, making the process of orientation a challenge.
To lay out the process:
When we look at brands in a certain category more often than not you will first look at growth in dollar sales. At first glance it may tell you how these brands are performing but it could be only showing you one part of the picture. Looking at what is called Equivalized Sales or EQ for short may help you to understand what is going on at the unit sales level. EQ measures total physical sales and commonly uses pounds, ounces or cases as the measure throughout a category. This is especially helpful when looking at items in category such as cookies, where package sizing tends to change. Are shoppers buying more product or is it that more smaller package sizes purchased are the result of unit sales? More times than not the metrics we look at are only the beginning to asking the right questions.
Before looking at EQ sales keep in mind that all items need to be calculated using the same unit of measure. For example, you do not want to cross compare one item measured in ounces against another item measured in pounds. So, make sure you are deciding on a standard unit of measure across items being evaluated.
Let’s take a look:
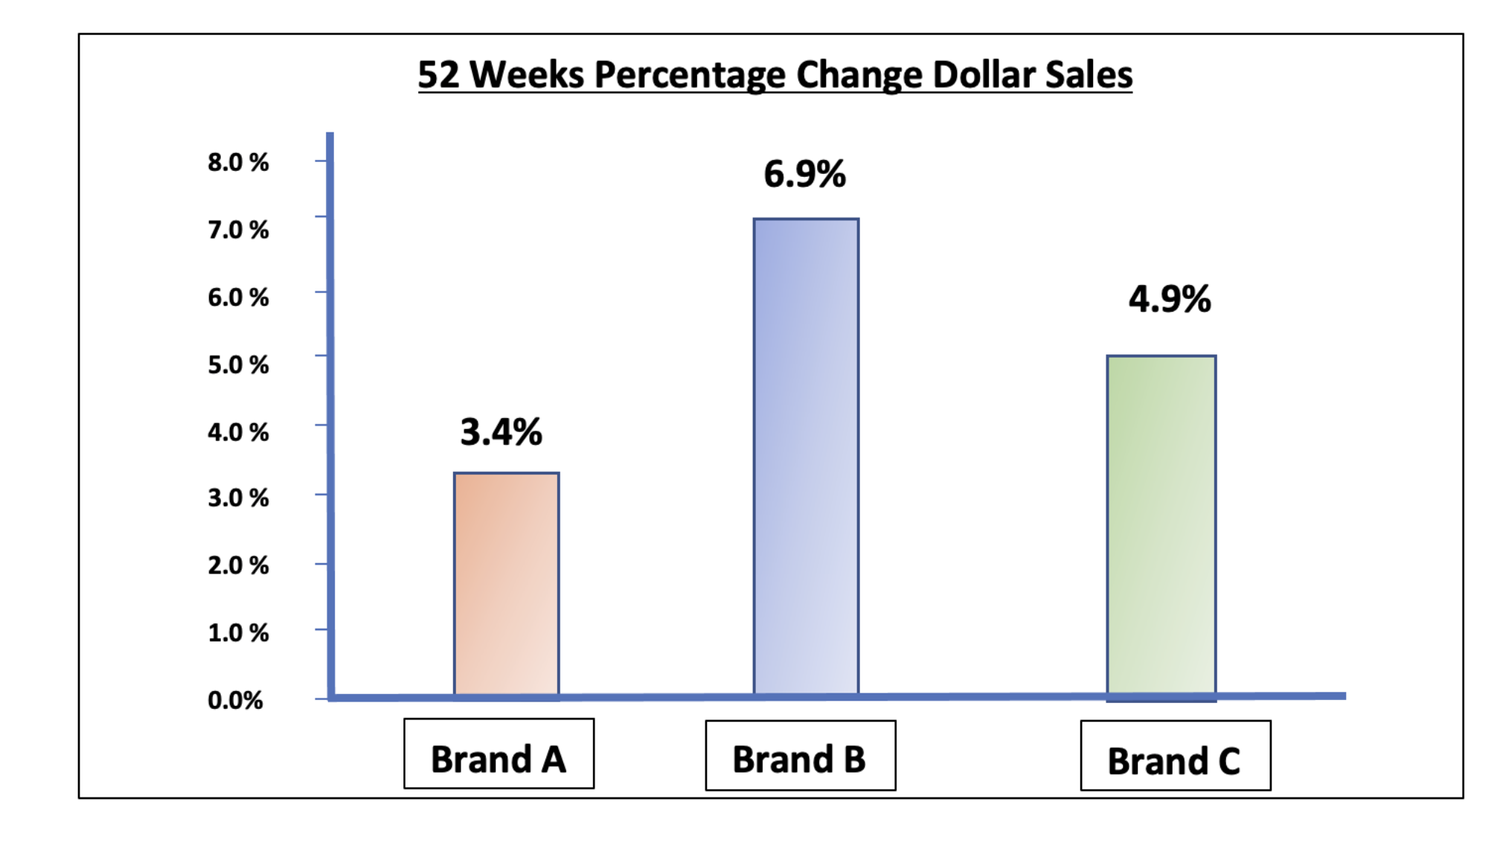
If we look at the yearly percentage change in dollars from a particular retailer we see by looking at just this metric : Brand A has a dollar sales growth of +3.4% from a year ago, Brand B has the highest sales growth from last year with +6.9% and finally Brand C finishes off at +4.9 dollar sales growth from last year.
Now let’s look at the unit sales for these three brands for the same length of time (52 weeks):

As we input Unit Sales into the equation for the 52 weeks, we see that Brand A may be in a little less firm ground as their unit sales are down although posting higher sales dollars. Brand B is showing a larger dollar sale however only a small gain in unit sales and Brand C seems to be performing the best as they are seeing both dollar and unit sales growth.
Now that we have looked at both unit and dollar sales, we paint even a bigger picture by adding in EQ volume:
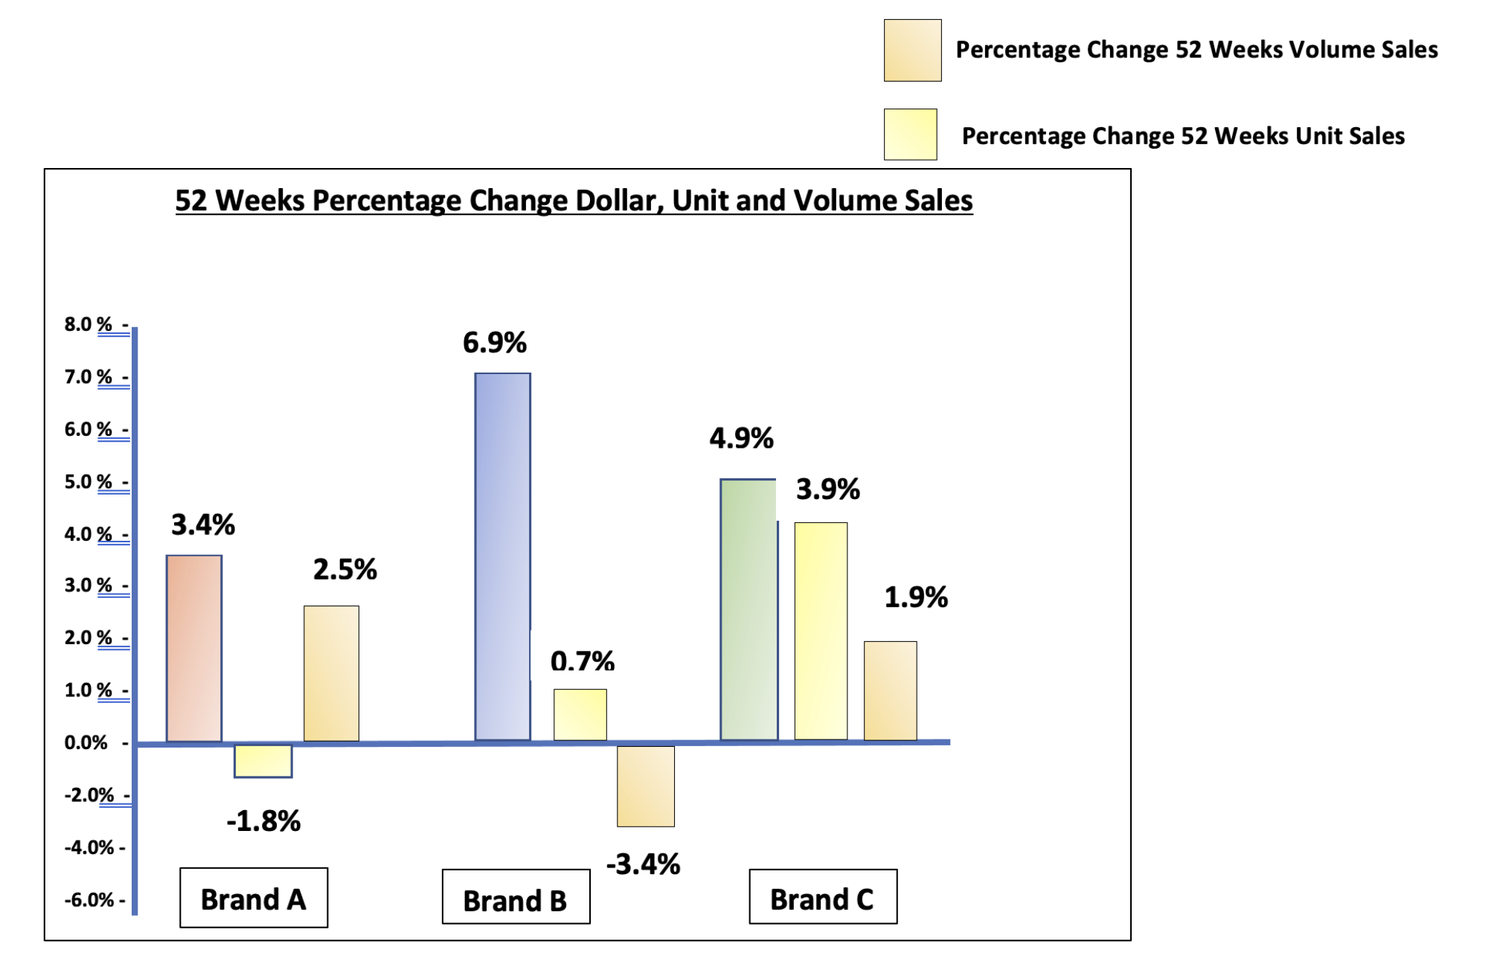
Examining the three metrics we can see that Brand A has increased dollar sales, declined unit sales and increased EQ volume. This can point to an average increase in pricing along with a packaging that is larger, the unit size is larger. Brand B has increased dollar sales, relatively flat unit sales and a declining EQ volume sales. This could point to an average higher pricing with a smaller average unit size. Brand C has increased dollar sales, increased unit sales and slightly increased EQ volume. It may show that Brand C as maintained pricing or slightly increased it while offering relative same sizing or slightly increased in size.
By cross-comparing metrics with your dollar sales it may paint a bigger picture which can allow you to come to some detailed conclusions in category. When adding EQ volume into your metrics it can help understand what’s going on at the unit level. You can also measure the amount of share your product holds in the respective category as a whole. This involves totaling and getting an average of size of units sold and multiplying this by total units sold. This may be a good follow up article from the one here today!
Often is the case that some categories rely on consistent promo pricing to help gain ahead of a large competitive category. As we know pricing is one critical piece in how consumers perceive the quality of your products. The question you need to ask such categories that require regular promos is: What’s your average price? Average price is a good place to start when understanding pricing at retail level.
Your average price will come from two factors, your everyday price and your promo price. Keep in mind:

In order to begin to analyze average price we need to understand that average price is derived from knowing our total unit sales.
Overall average for a specified amount of time: sale price = revenue/unit sales
Example: Joe’s Beverages 12 oz in an 18-week period made a total revenue in Chain X of $78,700. For 10 of those weeks the unit price was an everyday price was an everyday price which is $3.85 with a weekly sale’s of 1000 units and for the remaining 8 weeks the unit price was a promo price of $3.35 with a weekly sale of 1500 units. This means that Joe’s Beverages 12 oz total units sold was 22,000 for all 18 weeks.
78,700/22,000 = $3.58
Your Sell though percentage is a great tool in connecting the dots when looking at such things as dollar points of distribution or ACV. As with most analytics your trying to determine width and depth of your sales activity. You may have different SKUs with different depths of sell through. Sell though percentage can level out the playing field so to speak as you look at your inventory units across different SKUs and total units of these SKU’s sold.
Unit sales/total units sold = sell through %
Example:
You may have 4000 units of SKU X and you have sold 2000 of this SKU therefore your sell through equals 50%.
You also have only 600 units of SKU Y and you have sold 480 of this SKU therefore your sell through percentage equals 80%.
Even though you sold less unit sales of SKU Y your sell through percentage is in fact better than SKU X.
The next part of this picture is how much each SKU is being sold for? Is there a difference in pricing? You may see that depending on price the item that sold less inventory is making you more in sales dollars. What is the difference in number of outlets selling a SKU? Measuring sales performance is usually the starting point!
How do we put a dollar value on the impact of having your brand placed in more stores within a chain? Aside from your present distribution point and ACV percentage, knowing the worth of one more point of distribution can be a useful metric.
Example:


Your brand is presently holding at an annual sale of $650,000 in a chain and is sitting at 55% distribution. By calculating how much each additional point of distribution you can capture, you will be able to answer how much more would be sold at a percentage gain.
The first step in all of this is to calculate your velocity in order to put a dollar amount to a point of distribution (SPPD):
Calculation:
650,000/55 = $11,818
By our calculation we see that each point of ACV distribution for your brand in this chain sells for $11,818. From here we can plug in the velocity to understand how large the opportunity is for different levels of distribution:
By looking at our sales chart you can see that if your brand hits 70% ACV distribution this means 15 points above current distribution which is worth over $175,000 annual in sales:
70-55 = 15
15 * 11,818 = 177,250
That makes it 27% higher than your current annual sales:
177,250/650,000 = .272 (27%)
With point of distribution worth, you can now put an amount to missing sales either at the brand or item level in a specific chain. Understanding velocity and ACV % warrants its own future article as well as chain behavior. Stronger reliable stores within a chain for example, tend to bring in more products and earlier on. Velocity may be lower as you move towards 100% chain penetration.
Brands have experienced the pressure to come up with promotional plans especially when a category relies on competitive promotions or having to look at realigning prices within a category.
The importance of planning before offering discounts along with understanding how these discounts affect your margin and sales goals are crucial. In this article, we are going to look at how price adjustments play into your margin.

In this first example, we look at the scenario of a standard deduction in pricing. The question from a gross margin standpoint is: How much will I have to increase my volume of sales in order to maintain the same gross profit?
25-10=15, 10/15=0.06666 X 100= 66.7%
In a second scenario let’s suppose instead of taking a price decrease you decide to raise prices. The question to ask is: How much fewer in sales can I have in order to maintain the same gross profit?
25+5=30, 5/30=0.1666 X 100= 16.66%
As you may already know without doing the math, if we plug in a higher current margin let’s say 50% you will find that the market favors higher margins. Using the first example above a current margin of 50% with a 10% price reduction means that now you will need to increase your volume in sales by 25%. Likewise, if you increase prices and your current margin is at 50% and you increase prices by 5% you now can sell 9% fewer in sales in order to maintain the same gross profit.
So, when we are looking at price changes and knowing we are dealing with the three elements of sales price, COGS and gross profit remember that our sales price is what is being changed in the equation, therefore, changing our gross profit percentage.
Your outsourcing sales management solution for implementing your sales channel in the natural trade.